The Geometry of Expertise: Mapping R&D Capability in High Dimensions
A university is between an R&D lab and an open-source project. Top-down levers fail. So I built a pipeline to map 1,900 researchers as a navigable knowledge space to turn 'corridor knowledge' into strategy.


"What is your research strategy?" is the most common refrain in academic leadership. And while we will speak grandly of leading hundreds of PI's, deep down, we know that we are managing high-performance sole traders; the more brilliant they are, the less likely they will be to want, need or receive guidance.
Yet, our challenge remains in bridging the silos of disciplinary expertise – a capability that is increasingly demanded by funders such as ARIA to deliver the biggest impacts.
A university is halfway between an industrial R&D lab, and an open source project. Yes, we pay researcher's salaries. But top-down corporate levers will rightly fail when directing research; long-term blue-skies innovation is never imposed from leadership. While neolabs can align through equity, university strategic innovation requires nuance and a fundamentally non-coercive approach. in fact, it is rare for any of the classic leadership styles to be effective in academia.
To lead a huge, brilliant, and intrinsically independent group of researchers without traditional levers of management, our only alternative is to understand them at scale; we must map capabilities better than the individuals understand it themselves. Without this, leadership can be myopic – only engaging a visible subset through corridor knowledge and personal networks – or worse, fully disconnected from their biggest strategic resource.
So, I built a pipeline to fix this.
The Geometry of Expertise
Large Language Models rely on embeddings to convert words to a conceptual vector. Embedding is a technique to compress words and sentences to a unique position in a space, where neighbouring concepts ("lasers" and "fibre optics") are close together.
For this pipeline I used the AllanAI developed SPECTER2. This is specifically trained on academic literature rather than general language, using a paper's citation network as a proxy for conceptual closeness. In short, it is an accessible model to turn the conceptual focus of an academic paper into a 768 dimensional vector.
For every academic in my faculty, I can get their research paper abstracts via openalex; I'm avoiding institutional CRIS to focus on public data. Each normalised embedding provides one data point and the collection of works associated with an academic form a point-cloud.
My suspicion is that we can consider an academic's career as a "blob" in high dimension space. I pulled my own 100+ published papers; the image below shows the process of taking one specific paper and demonstrating the embedding to 768-dimensional space, followed by a principal component analysis projection to a high-signal 9-dimensional subset.
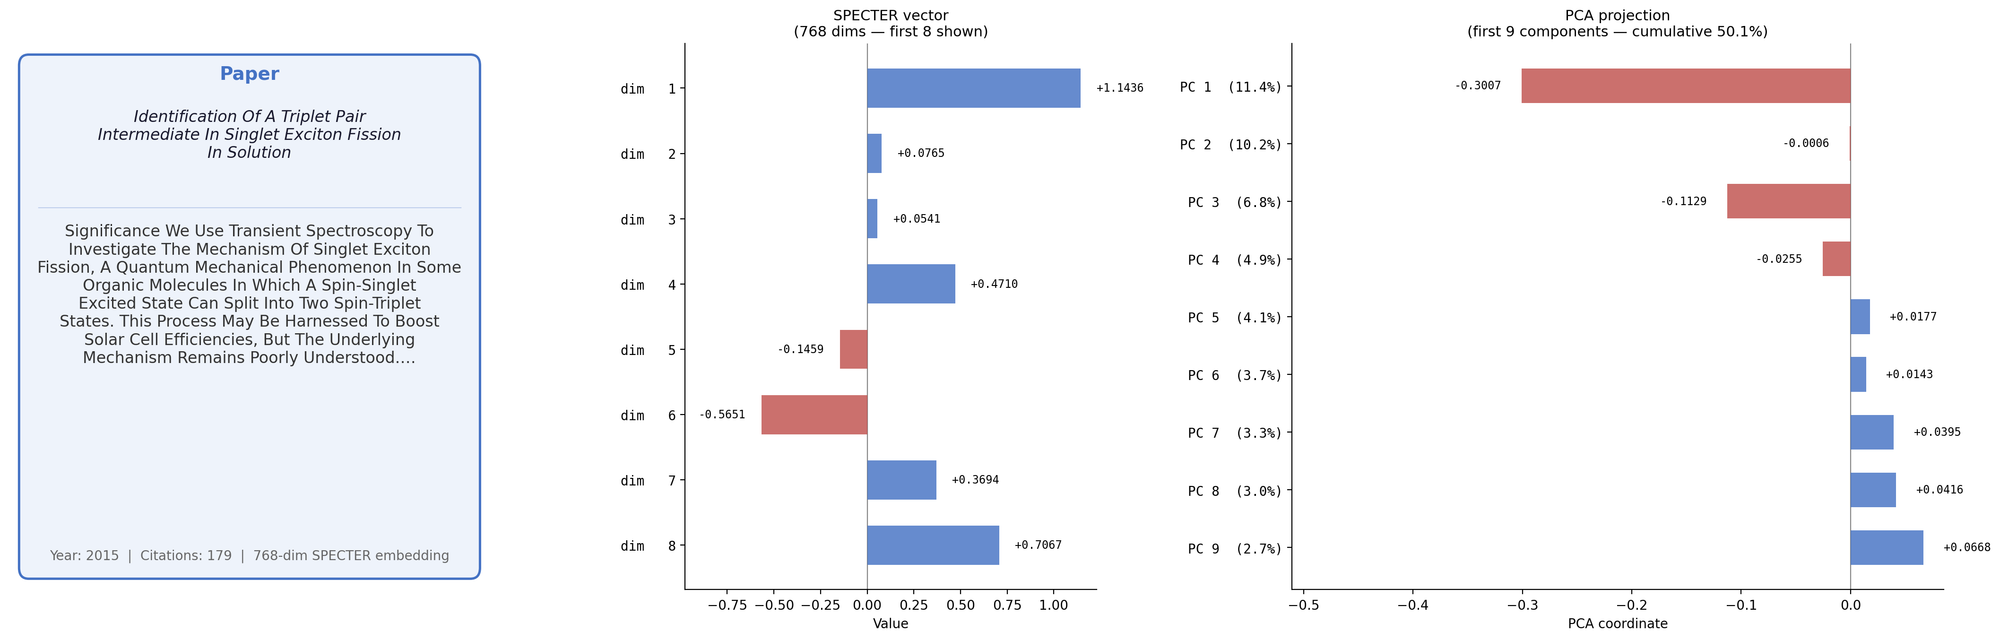
The first two PCA components explain about 20% of the conceptual variance in my research; this is enough that to make a scatter-plot of my papers as below. The axes on the plot correspond to directions in conceptual space – while sentenceBERT does not provide guarantees of manifold smoothness (unlike a clustering model), for closely related topics we can still invert from position back to concepts.
A linear probe – where a wide range of concepts are encoded, and a regression model finds the closest match – is a useful proxy to label the axes and give an idea of the concept space that an individual explores.
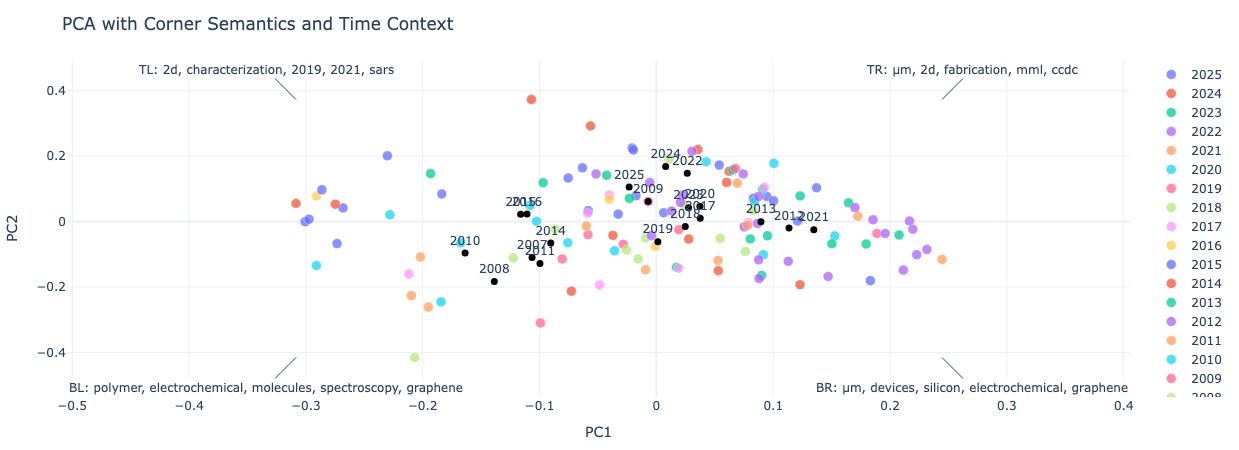
My work spans "polymers, electrochemical, molecules, spectrosopy, graphene" to "2D, fabrication, mml, ccdc"... not perfect, but directionally correct. This is interesting, but a more important question is how we can determine if a given researcher is a specialist or a generalist; this is signal of interdisciplinarity essential to build-out new teams.
Because embeddings are typically evaluated via cosine similarity (mapping points onto a hypersphere), we can apply directional statistics; methods such as the Von-Mises concentration provide the spread of research carried out by different researchers. We can then compare this by different fields, with larger numbers indicating more concentrated/specialist researchers.
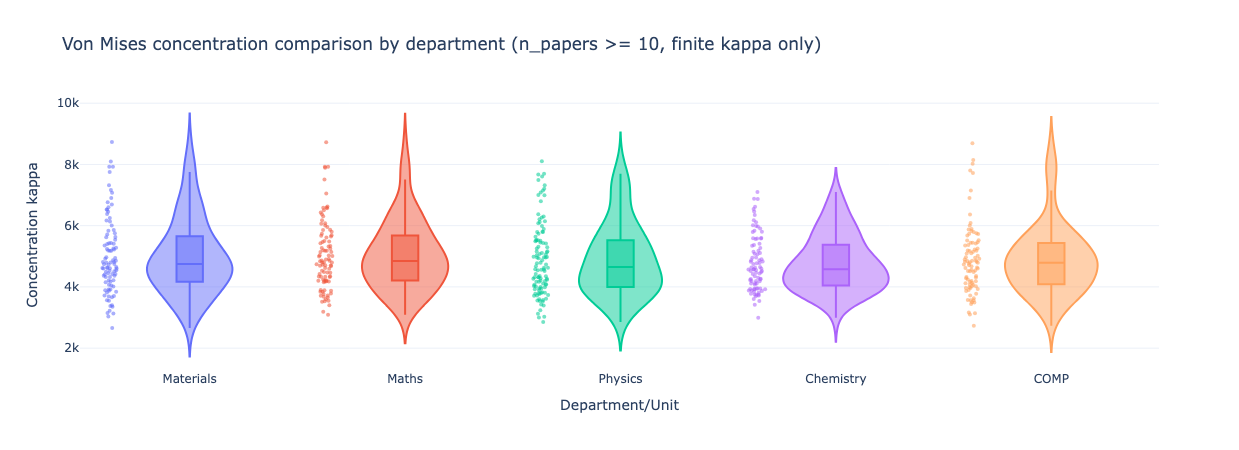
One possible reading here is that Chemistry is generally more interdisciplinary, and materials has a longer tail; in any case, we clearly have a variety of behaviours across all disciplinary boundaries.
Individual Vectors to Institutional Topography
Because the data is open-source and the embedding is local, it is straightforward to scale-up this analysis from individual level to discipline level or even institutional level. Here, a clustered visualization using UMAP provides the clearest view, with one point per researcher and proximity giving conceptual research similarity. No labels were provided: clusters are entirely self-organised.
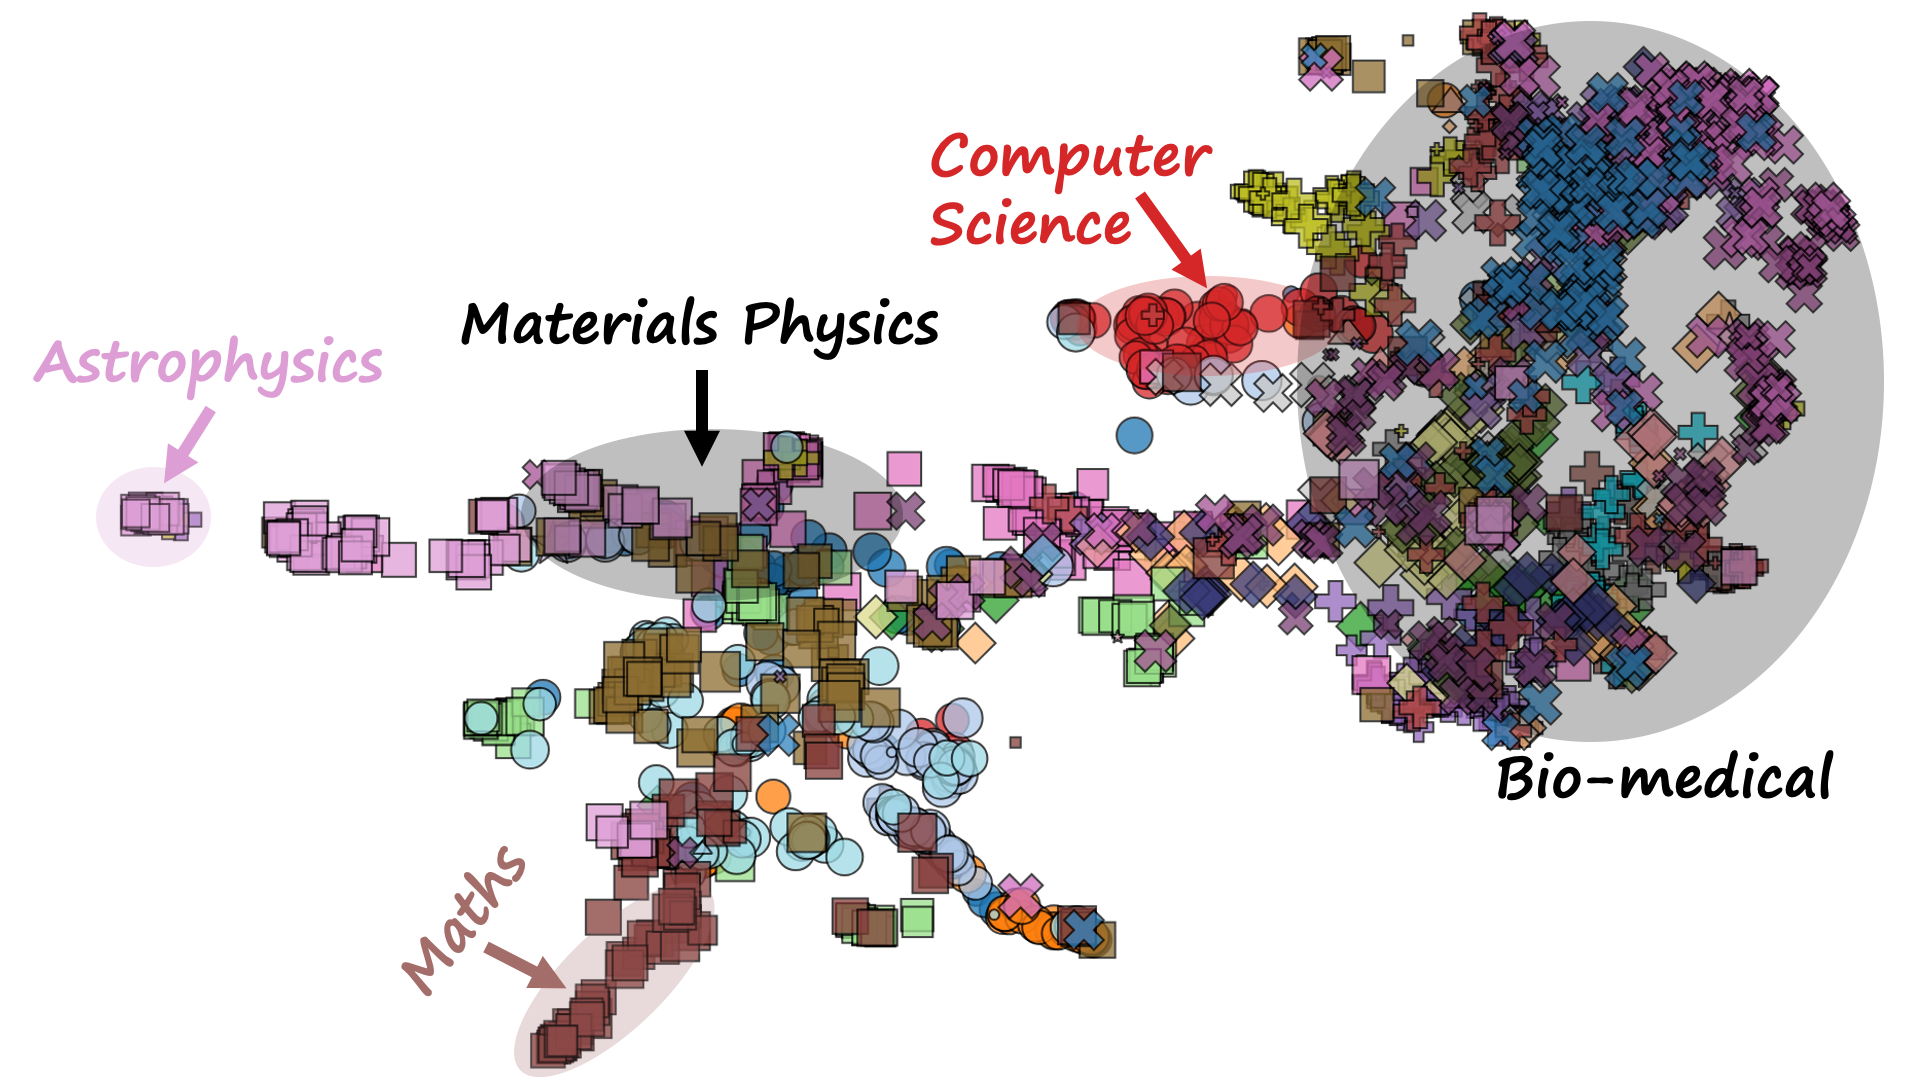
That's over 1900 academics, with science [squares], engineering [circles], and more, with disciplines by colour; astrophysics is off to the left in pink, maths is the bottom left tendril in brown, and the dense cluster at the right represents clinical and medical. These clusters emerge without supervision – disciplines so conceptually distinct are separated automatically.
It's prototyped and in internal development; it is essential that as a decision support tool it is ethically used, and rollout will need co-design with the researchers it is intended to support.
Levers for R&D Leadership
Access to a numerical expertise vector for R&D staff that does not require active administration provides new strategic actions:
- Engineering Serendipity: Chance encounters — the watercooler moments — only work when people overlap in time and space. Our embeddings remove that constraint: we can now surface researchers who are conceptually proximate but have never collaborated, targeting introduction before the serendipity has to happen by accident. Filtering for above-average interdisciplinarity in both researchers makes the signal stronger — these are exactly the boundary-spanning individuals most likely to seed genuinely new activity.
- Targetted Search: We can move beyond keyword search to conceptual search. Whether a press office looking for a spokesperson, an internal review looking for a panellist, or a specific grant call demanding an unusual combination of skills, we can now query in deeper way.
- Strategic Hiring: Hiring new appointments can be supported with a map of current capability. Whether seeking to build critical mass between current expertise with junior appointments or start a new activity in a "conceptual void" with a keystone hire.
While this is developed for universities, it can be applied far more widely across R&D. A venture capitalist can explore synergies across a portfolios (or by adding a new hire) to bridge fields. Governmental policy makers can explore gaps or strengths in national capability for selective investment. A talent acquisition team might explore specific capabilities using open-source data to broaden their search.
Used effectively, these levers are not just tools; they are a mechanism to support the shift from a passive talent inventory to active support strategy, starting from ground up.
Innovative Crowd to Mapped Capability
Modern academics are not management-directed researchers... but they also fit awkwardly in the 11th century structures of higher education. Capturing the latent value of university R&D at the scale of a contemporary university requires modern strategic tools.
A university or R&D lab that cannot map its own knowledge can never strategically lead research; it merely hosts it.